
A knowledge graph to interpret clinical proteomics data
Alberto Santos, Ana R. Colaco, Annelaura B. Nielsen, et al. Nature Biotechnology, Vol 40, May 2022.

Outline: brief paper summary followed by implications
We (scientists + clinicians) have amassed a large amount of data within multi-omics (genomics, transcriptomics, proteomics, and metabolomics), clinical research, and laboratory research, but it is nearly impossible to manually glean integrated insights. Further challenges are encountered due to the heterogeneity and unstandardized modes of data production and storage.
Scientists from the NNF Center for Protein Research in Denmark developed a clinical knowledge graph (CKG) comprising ~20M nodes and 220M relationships representing information from experimental data, public databases and literature. The CKG combines statistical and ML algorithms to accelerate the analysis of proteomic data and enable precision clinical decision-making.
Let’s dig in —
Zeroing in on proteomics, mass-spec based proteomics (Figure 1, source) enables comprehensive and quantitative profiling of proteins and their interactions and modifications. An example proteomic workflow consists of biological sample preparation (tissue culture), protein isolation, conversion of proteins into peptides, mass spectrometry, followed by computational biology for data analysis and insights.
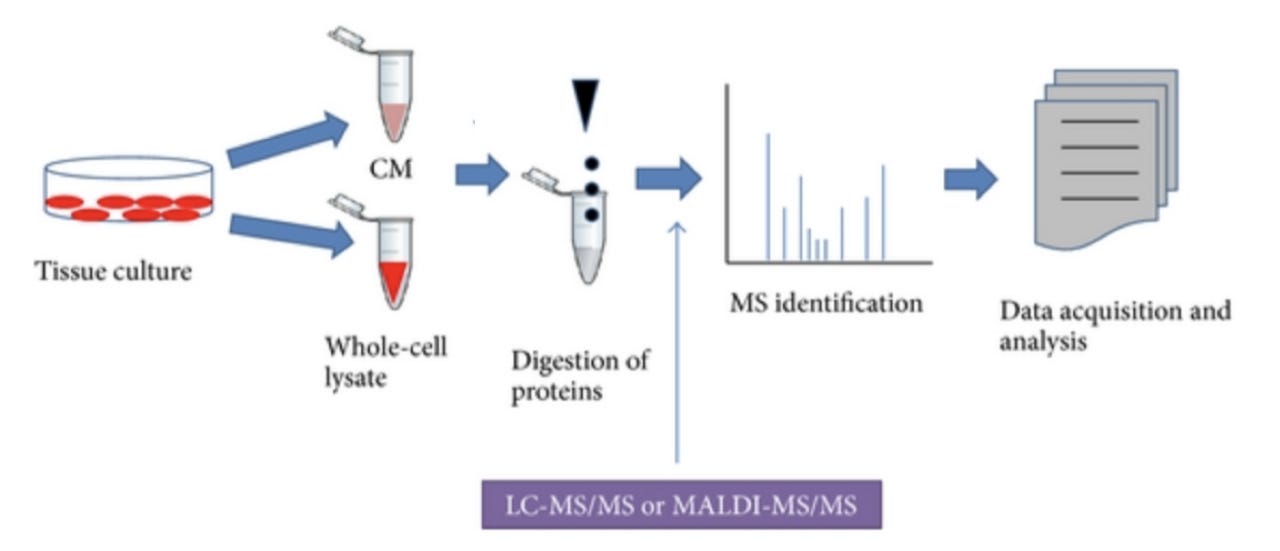
The final step (data analysis and insights) presents a major bottleneck, particularly with big data. Tools that enable integration of multiple data types, map the relationships between existing multifarious data, and output results that enable formulation of biological or clinical hypotheses are needed. Simply put — we want to be able to consider all relevant existing data as we draw conclusions from new data.
Santos et al. present a knowledge-based platform that integrates multiple databases and scientific literature with -omics data into a workflow that empowers discovery and translates into clinical practice.
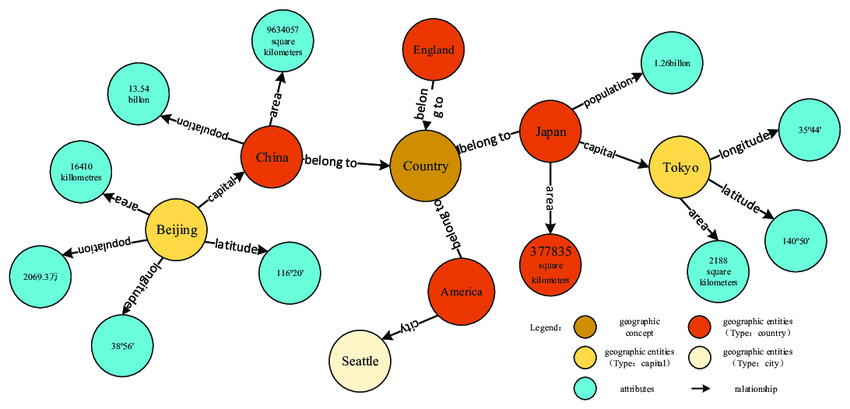
Knowledge graphs are a method of displaying the relationships between data points, enabling use of network analysis to glean new insights (Figure 2).
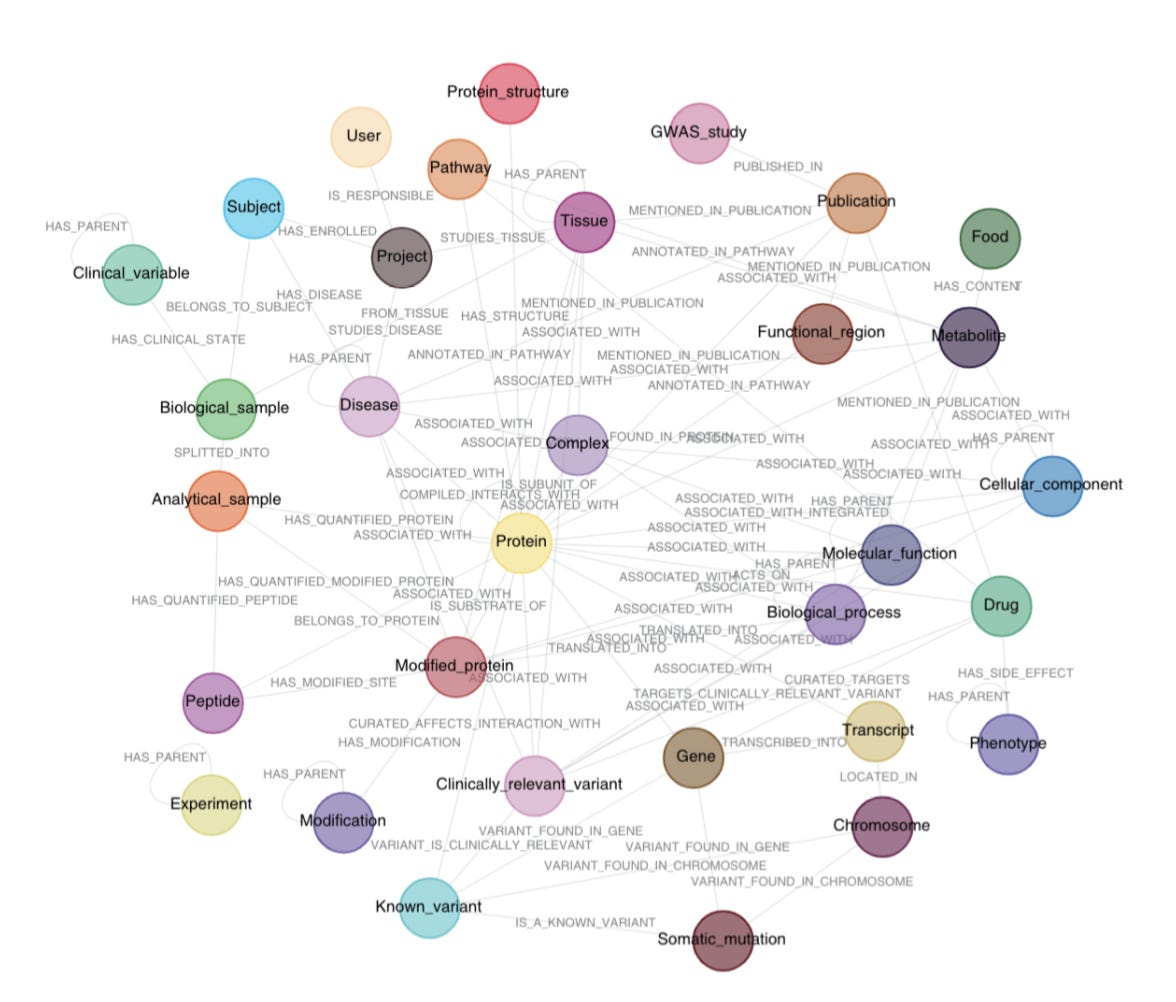
Santos et al. developed a knowledge graph that aggregates existing -omics data with biomedical databases and scientific literature to create a clinical knowledge graph (CKG) that enables automated data analysis, knowledge mining and data visualization (Figure 3).
4 modules of the clinical knowledge graph
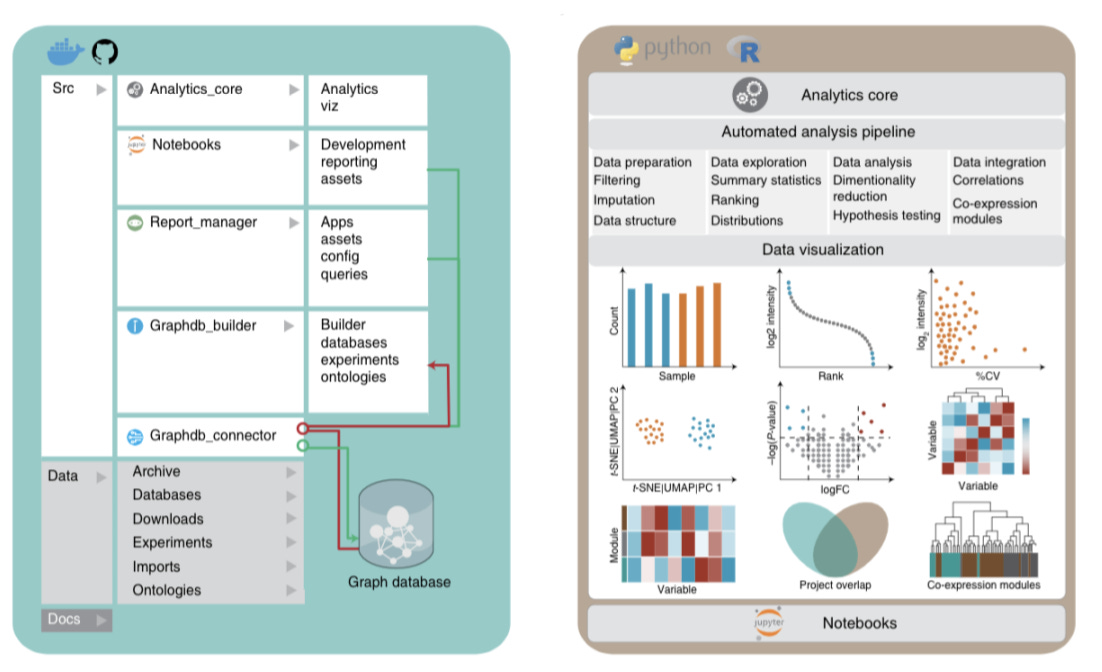
1) Analytics Core that formats and analyzes proteomics data + existing omics, clinical data, biological context + scientific publication mined text with the following additional features:
Data preparation (filtering, normalization, imputation, and data formatting)
Data exploration (summary statistics, ranking, and distributions)
Data analysis (dimensionality reduction, hypothesis testing and correlations)
Visualization
2) Graphdb_builder that constructs a graph database by integrating existing experimental data, ontologies, and scientific publications with newly generated proteomics data and includes the following features:
A library of parsers (parsers break data down into smaller elements) that download data from online sources and generate entities (nodes (circles in the knowledge graph)) and relationships (lines connecting the nodes)
Santos et al data model connects 36 different node labels with 47 different relationship types that integrate clinical data, omics data, and publications (Figure 3)
3) Graphdb_connecter that connects and queries the graph database
Collects annotations from 26 biomedical databases
Organizes information into ~20 million nodes connected by 220 million relationships
Scalable, and can integrate new + existing ontologies, databases, and experiments
4) Report_manager that facilitates data visualization, repository and analysis
All reports, analysis results and visualizations can be downloaded as a single compressed file containing tables and figures in ready-to-publish format (Figure 4).
Clinical implications of the clinical knowledge graph
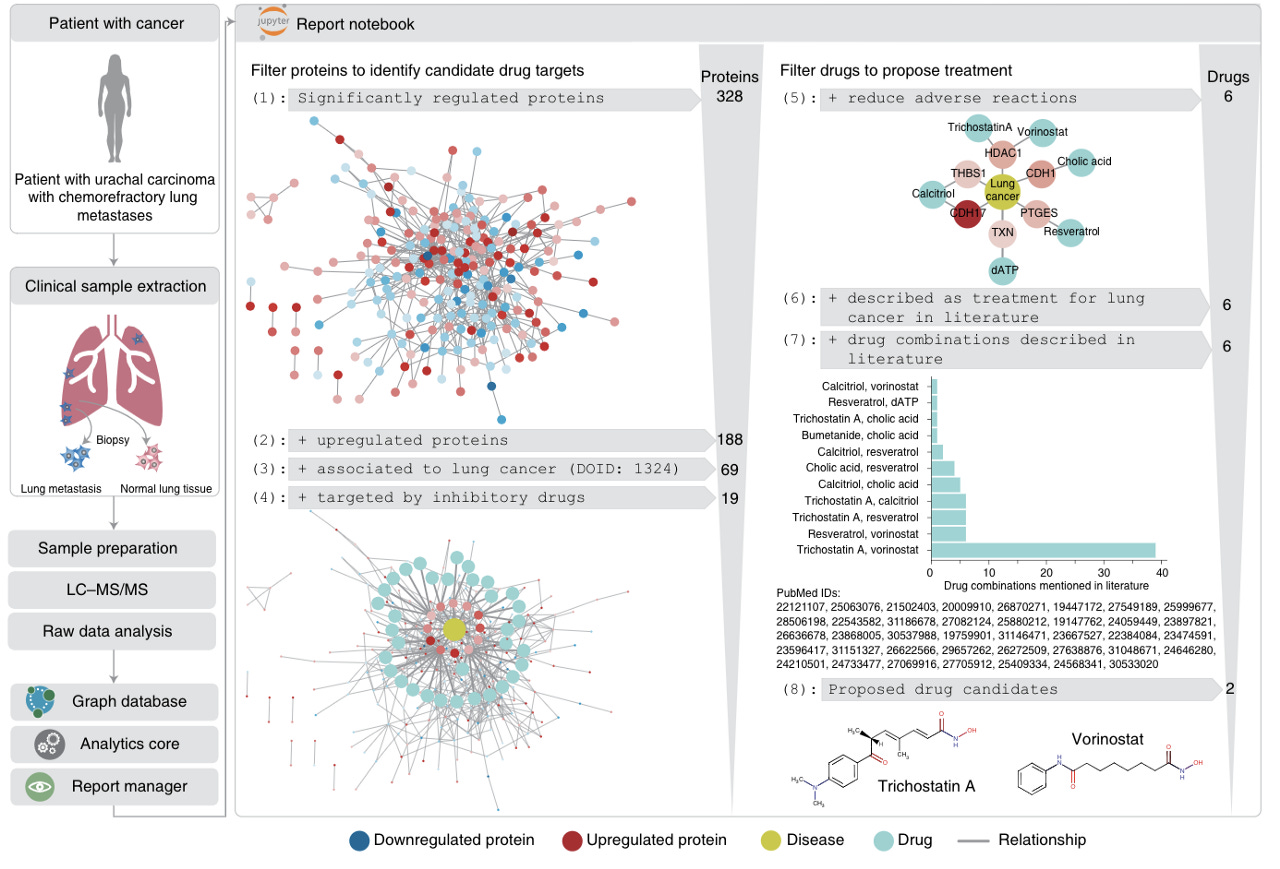
Santos et al further demonstrate the strength of the clinical knowledge graph by displaying its ability to propose personalized cancer drug candidates based on patient-specific proteomic profiling following biopsy (Figure 5).
Implications
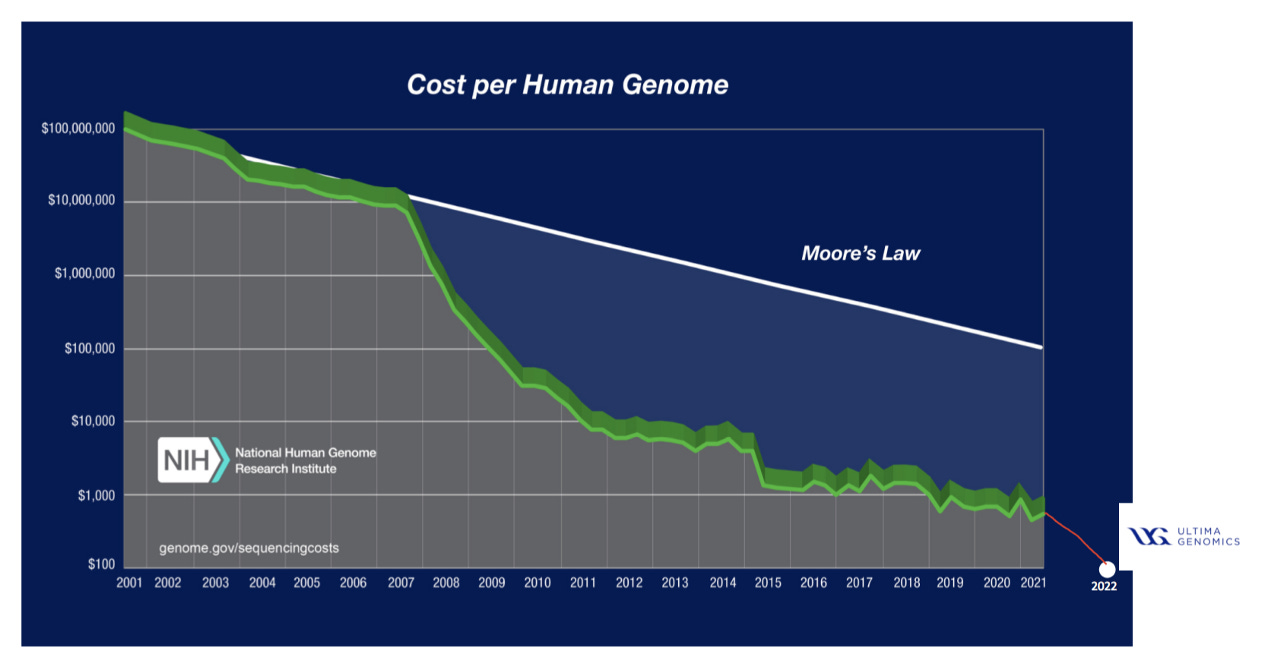
Omics data is increasingly cheaper to generate, resulting in large volumes from diverse sources. This presents a requirement for workflows that integrate existing omics data with newly generated data and glean key insights and relevant clinical implications. The decreased cost of genomic sequencing (Figure 6) is evidenced by Ultima and their ability (with limitations) to sequence a whole genome for $100, down from ~$10k/whole genome in 2012.
The emergence of large scale proteomics (Protai, Nautilus, Biognosys), transcriptomics (Spatial Transcriptomics now part of 10x Genomics, Scipio Bio, BioTuring), and metabolomics (Matterworks, Metabolon, Olaris) companies are also accelerating the rate that omics data is amassed.
Despite the emergence of omics companies generating big data, a key limitation is that the data generated is largely proprietary, thus limiting the scope of publicly accessible data that is necessary to train models and strengthen clinical knowledge graph workflows. Public databases can be strengthened through a concerted effort by scientists and clinicians to upload data onto open source platforms, with further contributions from data scientists and computer scientists to develop automated workflows that enable integrative analysis of multi-omics and clinical data to ease interoperability and end-to-end analysis and interpretation.
A major limitation of aggregating data from open source platforms is the unstandardized nature of experimental protocols and data acquisition methods between different research labs. Biotech companies benefit from the ability to implement end to end standardization in generating proprietary high throughput data sets. Subsequent data analysis can integrate graph-based machine learning to generate novel insights and facilitate drug discovery and development for building internal product pipelines. Along with building internal pipelines, biotechs are also implementing service models where big pharma (or other private biotech companies) use their proprietary tech stacks to enhance their workflows.
Feel free to reach out directly if you are building within this space or want to chat about the ideas presented in this article as we are excited to invest in founder-led tech x bio at Hummingbird VC. I’m also happy to receive paper suggestions.
References
Santos, A., Colaço, A.R., Nielsen, A.B. et al. A knowledge graph to interpret clinical proteomics data. Nat Biotechnol 40, 692–702 (2022). https://doi.org/10.1038/s41587-021-01145-6
Thanks to Ketan Yerneni, Brooks Musangu and Pablo Lubroth for their edits and contributions.